Step 3: Range Values
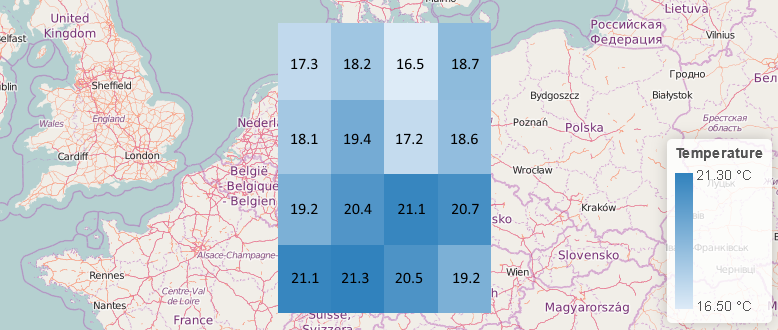
We know the temperature of each grid cell from the image above. In CoverageJSON data values are associated with grid cells with the help of a multi-dimensional array that is encoded as a flat one-dimensional array, here called NdArray. In general Coverage terminology, the set of values of a parameter are also called the Range. NdArray is one particular encoding scheme for Range values. Let's have a look at the code first:
{
  "type" : "NdArray",
  "dataType": "float",
  "axisNames": ["y", "x"],
  "shape": [4, 4],
  "values" : [
    17.3, 18.2, 16.5, 18.7,
    18.1, 19.4, 17.2, 18.6,
    19.2, 20.4, 21.1, 20.7,
    21.1, 21.3, 20.5, 19.2
  ]
}
We can see that the values (by the way, missing values would become null) appear in the same layout as in the image above.
There are two reasons for that:
- NdArrays always use row-major order.
The first array axis is
y(latitude) and the second axisx(longitude), as given inaxisNames. With row-major order, the indices of the rightmost axis, herex, vary fastest. This means that you start withy=0and iterate throughx=0..3, theny=1and againx=0..3, untily=3. - The connection between NdArray axis indices and Domain axis coordinates is established by the ordering of the Domain axis. There is a difference between an axis going from 54° to 48° and one going from 48° to 54°.
If we had switched the NdArray axis order around from y-x to x-y, then our array would look like that:
{
  "type" : "NdArray",
  "dataType": "float",
  "axisNames": ["x", "y"],
  "shape": [4, 4],
  "values" : [
    17.3, 18.1, 19.2, 21.1,
    18.2, 19.4, 20.4, 21.3,
    16.5, 17.2, 21.1, 20.5,
    18.7, 18.6, 20.7, 19.2
  ]
}
Columns become rows, and rows become columns.
Head over to the next page, we're nearly done!